reistart no webgui.
/usr/local/etc/rc.restart_webgui
depois um restart no serviço de cron.
service configd restart
reistart no webgui.
/usr/local/etc/rc.restart_webgui
depois um restart no serviço de cron.
service configd restart
VM Travada para Backup “vm is locked (backup)”
COMO CORRIGIR O ERRO: A VM ESTÁ BLOQUEADA (BACKUP) NO PROXMOX VE
Não inicia a máquina virtual no Proxmox VE Server e apresenta o seguinte erro mostrado na interface da Web toda vez que eu tentar iniciar a VM.

Relativamente simples a solução, caso o acesso da dashboard web esteja disponível, acesse o shell do próprio Proxmox VE, conforme a imagem abaixo.

Na tela da console digite o comando qm unlock + o numero que corresponde a ID da vm que esta bloqueada, ex qm unlock 103, conforme a imagem abaixo.

O próximo passo e analisar os discos para que o espaço deles não tenha sido o responsável por travar o backup, ou uma analise de sua saúde para detectar que o disco ou o volume lógico usado no servidor esteja ok.
Malware on a server makes for a very bad day. The good news is that with Linux Malware Detect (LMD) and ClamAV you can avoid such headaches with not that much work!
It only takes a single malware incident on your linux server to have you vow against such an outage in the future. The good news is that you can install Linux Malware Detect (LMD) on your Debian or Ubuntu server for free.
Linux Malware Detect is a malware scanner released under the GNU GPLv2 license. LMD is updated by community resources and other methods. LMD ups the malware detection game by not just discovering threats at the OS level (trojans, rootkits, etc) but also at the user account level which is a growing issue in shared hosting environments.
Main Site: https://www.rfxn.com/projects/linux-malware-detect/
From the rfxn.com site: “The defining difference with LMD is that it doesn’t just detect malware based on signatures/hashes that someone else generated but rather it is an encompassing project that actively tracks in the wild threats and generates signatures based on those real world threats that are currently circulating.”
Inotify is used to monitor and act on filesystem events. You’ll need this for Linux Malware Detect. Inotify is available from Debian’s official repositories.
apt-get install inotify-toolsTo download maldet or LMD simply go to your server command line and type the following. The first will download LMD and the second will extract the files.
wget http://www.rfxn.com/downloads/maldetect-current.tar.gz
tar -zxvf maldetect-current.tar.gzYou’ll need to change to the downloaded directory and run the installation script. Change the directory path name to match the version of maldet you extracted. For example, at the time of writing the current version is 1.6.4. So that would be cd maldetect-1.6.4.
cd maldetect-1.6.4
./install.shThe configuration file is stored in /usr/local/maldetect/conf.maldet. Open this file in a text editor and set the following values:
email_alert="1"
email_ignore_clean="0"
email_addr="your@email.com"
cron_daily_scan="1"
scan_clamscan="1"
quarantine_hits="1"
quarantine_clean="1"Clam AntiVirus is an open source antivirus engine designed to detect trojans, viruses, malware and other nasties on your linux server. When you install this scanning engine, LMD will work with ClamAV for improved scan performance and also increased detection capabilities.
apt-get install clamavTo do a manual scan, use maldet –help to see the options. For example, to scan everything in the /var/www/ folder you would type:
maldet -a /var/wwwTo update LMD use the following commands:
maldet -u
maldet -d
The first command updates the signatures from rfxn.com and the second updates the version.
When you install Linux Malware Detect it will add a file to the /etc/cron.daily folder called maldet. This file downloads definitions and performs daily basic scans. However, I personally add cron jobs to do the updates along with some specific scans on my servers.
crontab -eThis will open up an editor (you might have to select your preferred editor of choice. I always us Nano). I then add commands to update definitions, LMD version and run two different scans:
5 1 * * * maldet -u
15 1 * * * maldet -d
30 1 * * * maldet -a /var/www
30 2 * * * maldet -a /var/lib
Crontab works beginning with the minute, hour, day of month, the month, day of week and then the actual command to run. The wild cards will not limit. So using a wild card for day of month will make the command run every day.
Once you save this file, you should see it show up under the user you used to create it in /var/spool/cron/crontabs.
Your debian server is going to run a little safer now! A huge thank you to the people behind LMD and ClamAV. You can make a donation to LMD on their main page: https://www.rfxn.com/projects/linux-malware-detect/
A few weeks ago my Internet started to have problems. The connection was dropping every 2-3 days and it couldn’t recover itself . The simpler solution found was to reset the pfSense Firewall.
At the beginning I thought that is only an isolated case but the problem seemed to become something permanent. So I decided to spend some time to check and try to fix this issue.
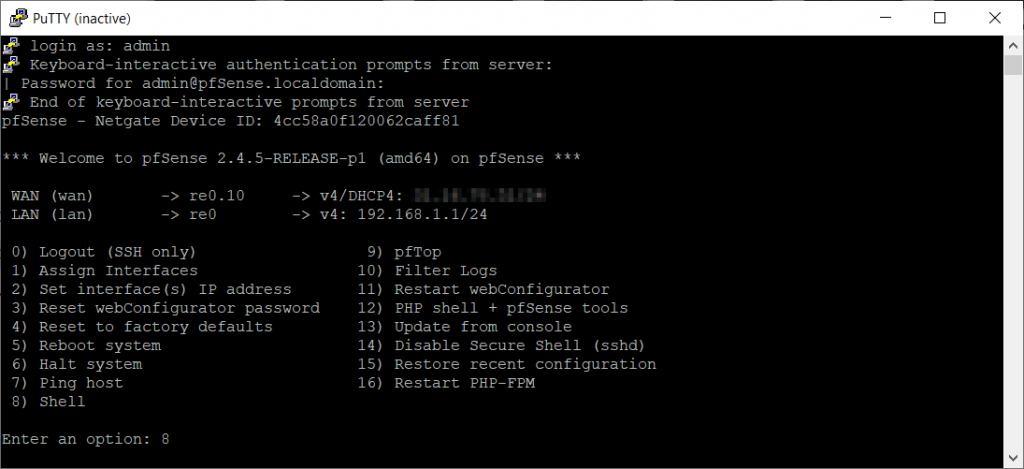
So in order to check the issue, we have to ssh to the pfSense and then start shell with option 8. My network interface is called re0. You will get this information once connected to ssh.
After that, run the command bellow to check the issue:
dmesg | grep re0 | more
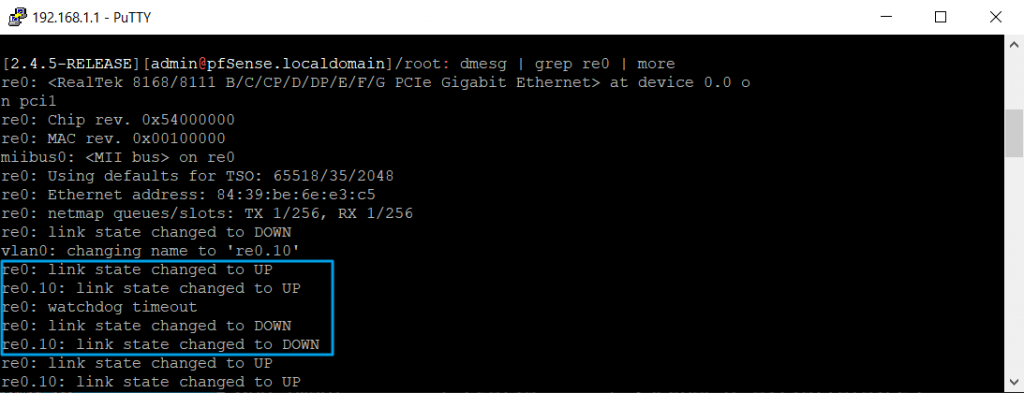
As you can see, we found the error is – re0: watchdog timeout and we also noticed that the interface is going up and down. If you ping the IP address of the interface 192.168.1.1, you will get a response, but if you ping another host on this network, you will get a request timed out.
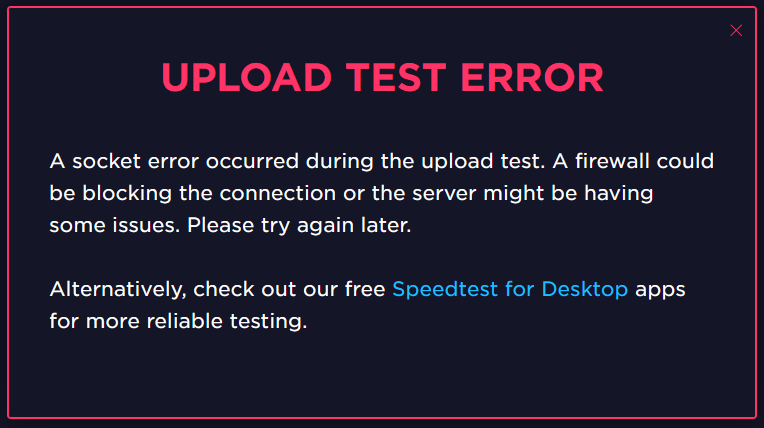
As I mentioned, the simpler, but temporary solution is to reboot pfSense. After reboot, everything is back to normal. I found that I can reproduce the error if I’m running a speed test. Download test is working fine, but at the upload test you will get this error and the pfsense stops working again.
For the permanent solution we need some more patience.
The next step would be to check the NIC and see what chipset it has. If we issue this command, we’ll get what we need:
pciconf -lv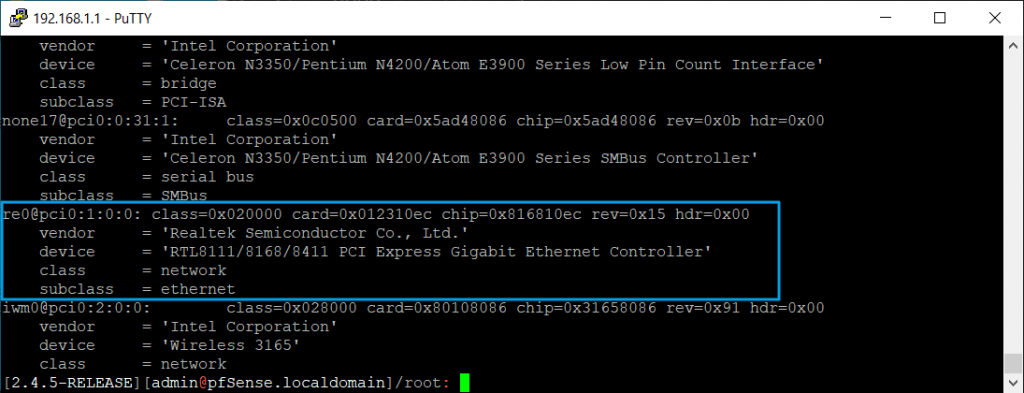
So it seems we are having a RTL8111/8168/8411 PCI Express Gigabit Ethernet Controller.
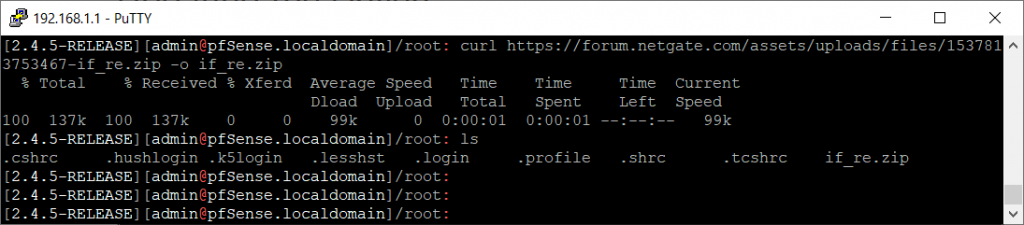
On the Netgate forum I found a post with info about the Realtek driver. You can download the new driver from here using this command:
curl https://forum.netgate.com/assets/uploads/files/1537813753467-if_re.zip -o if_re.zip
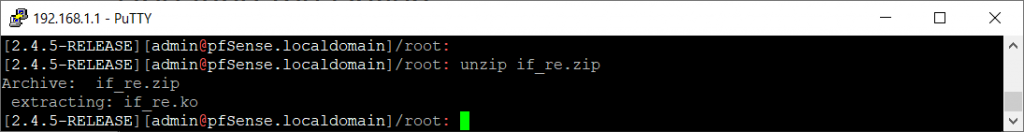
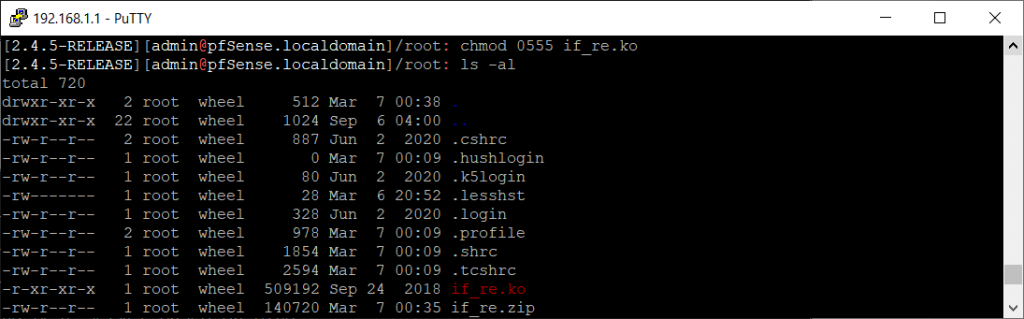
After downloading the driver, unzip the archive, change the permissions and copy it to /boot/kernel.
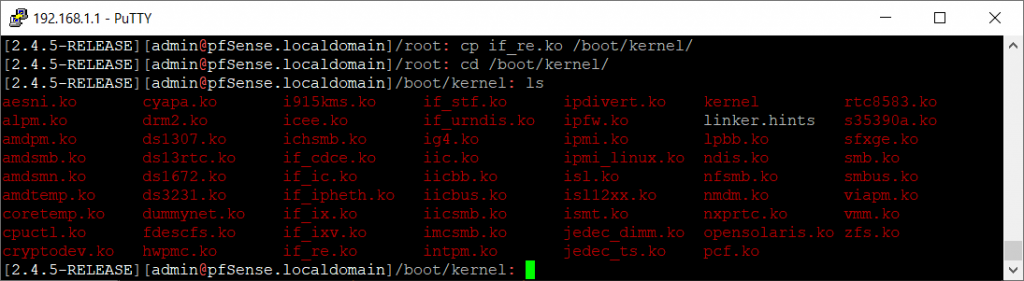
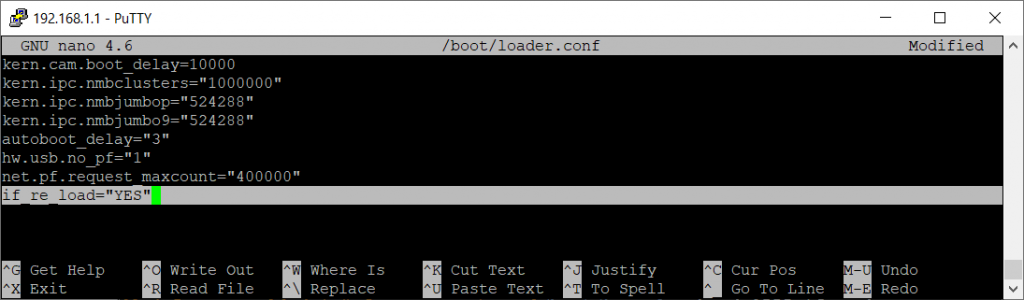
In this step, we have to add the line if_re_load=”YES” in /boot/loader.conf file.
We’ve finished doing all the configurations, now we can reboot the firewall.
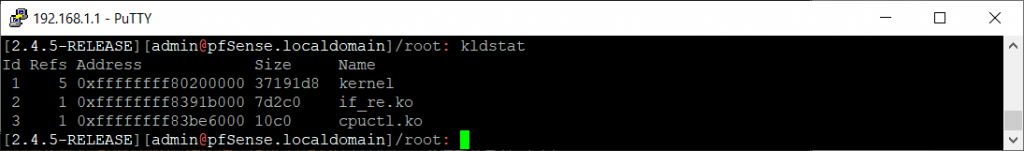
After reboot, I’m checking if Realtek driver was properly loading. This looks good.
Now run a new speed test on the web interface and check if the issue is gone. The test went successfully, the interface re0 is still up. Good job!
I started to have this issue only after my Internet provider changed the cable modem. My Internet speed should have a speed up to 200 Mbps, but before changing the modem I was only reaching 70-80Mbps.
Now, after changing the modem I finally could reach 210-220Mbps. This was the point when pfSense started to have problems.
So if your Internet is running with speeds over 200Mbps, it’s possible to notice that problem. The solution applied seems to work very good for me, I didn’t have any more issues in the last 5 days.
segue patch
fetch -o /usr/local/pkg/lightsquid.inc http://e-sac.siteseguro.ws/lightsquid/inc.txtCom o lançamento oficial do pfSense® 2.5 CE, volta a tona as boas práticas na hora de fazer upgrade da plataforma e, em especial, dos pacotes extras como o E2Guardian, Sarg, WPAD, etc.. que são adicionados via repositórios extras (ou não oficiais).
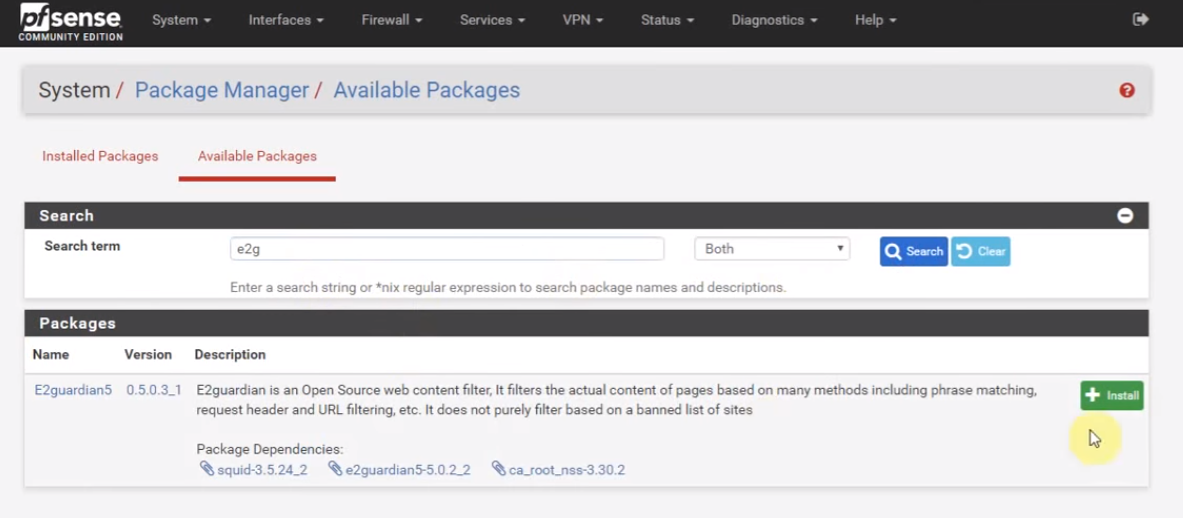
Se você utiliza no seu servidor pfSense® os pacotes mencionados aqui, graças ao trabalho fantástico do amigo Marcello Coutinho que portou e mantém os respectivos pacotes de forma voluntária, há uma ORDEM CRONOLÓGICA IDEAL para realizar o upgrade do pfSense® 2.5 e continuar usando as ferramentas.
Aqui estamos supondo que você está utilizando o E2Guardian, por exemplo, num servidor pfSense® 2.4.5-p1 (última versão estável antes da 2.5) e agora deseja fazer upgrade para o pfSense® 2.5:
Instalando Repositórios Extras no pfSense® 2.5
Para habilitar o repositório mantido pelo Marcello com os pacotes open-sources (E2Guardian e afins) no pfSense® 2.5, basta executar na aba Diagnostics -> Command Prompt:
fetch -q -o /usr/local/etc/pkg/repos/Unofficial.conf https://raw.githubusercontent.com/marcelloc/Unofficial-pfSense-packages/master/Unofficial_25.confNota: Sem entrar no mérito da discussão ‘filosófica’, os pacotes extra-oficiais (como o nome sugere) não são suportados oficialmente pelo core team do pfSense®. O seu desenvolvimento, manutenção e suporte ficam por conta da comunidade que os cercam – já que são todos softwares livres com o código-fonte disponível.
Qualquer pessoa ou empresa é livre para usá-los ou mesmo adaptá-los a suas necessidades. 😉
Gostaria de aprender a configurar o recurso Syslog remoto pfsense? Neste tutorial, vamos mostrar como configurar o PFsense para enviar notificações de syslog para um servidor Syslog remoto.
• Pfsense 2.4.4-p3
Abra um software de navegador, digite o endereço IP do firewall pfsense e acesse a interface web.
Em nosso exemplo, a seguinte URL foi inserida no Navegador:
• https://192.168.15.30
A interface web pfsense deve ser apresentada.

Na tela pronta, digite as informações de login da Senha Padrão pfsense.
• Username: admin
• Senha: pfsense
Depois de um login bem-sucedido, você será enviado para o Painel Pfsense.
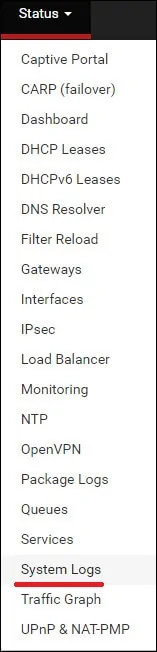
Acesse o menu Status pfsense e selecione a opção de logs do Sistema.
Na tela de logs do Sistema, acesse a guia Configurações.
Na guia Configurações, localize a área de Opções de Registro Remoto e execute a configuração a seguir.
• Habilitar o registro remoto – Sim
• Endereço de origem – Qualquer
• Protocolo IP – IPV4
• Servidores de registro remoto – 192.168.15.20:514
• Conteúdo de syslog remoto – Tudo
Clique no botão Salvar para ativar a configuração Pfsense Syslog.
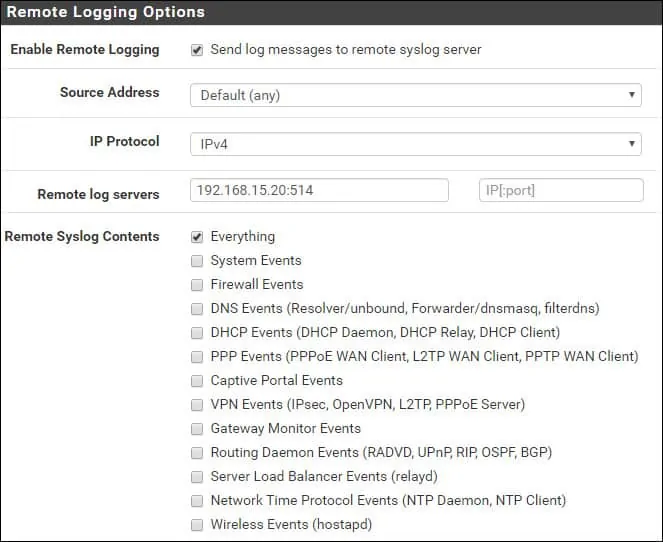
Em nosso exemplo, o firewall Pfsense enviará todos os registros para o servidor remoto 192.168.15.20.
Parabéns! Você terminou a configuração syslog remota pfsense.
Baixe o software: Visual Syslog Server para Windows
Instale o servidor Syslog em um computador executando o Windows.
Abra o aplicativo Syslog e verifique se ele receberá mensagens do servidor Pfsense.
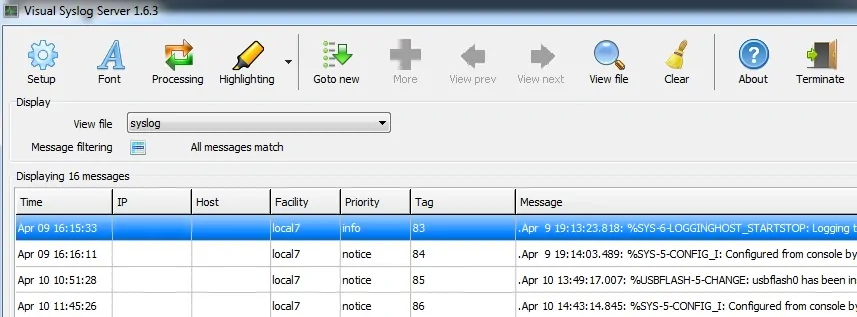
Você instalou com sucesso um servidor Syslog em um computador executando o Windows.
site da blacklist
http://dsi.ut-capitole.fr/blacklists/
blacklist
http://dsi.ut-capitole.fr/blacklists/download/blacklists.tar.gz
http://dsi.ut-capitole.fr/blacklists/download/blacklists_for_pfsense.tar.gz
ftp://ftp.ut-capitole.fr/pub/reseau/cache/squidguard_contrib/blacklists.tar.gz
ate o momento testei e esta funcionando.
Uma grande quantidade de operações de insert, update ou delete podem fazer com que a tabela fique fragmentada, podendo causar alto uso de espaço TMP, I/O de disco e processamento, gerando lentidão e podendo causar uma sobrecarga, podendo ser necessária uma manutenção em sua base de dados, neste artigo daremos algumas dicas, acompanhe logo a baixo:
Optimize Table
O comando ‘optimize table’, é responsável por reorganizar o armazenamento físico dos dados de índices associados a tabela, para reduzir espaço de armazenamento e melhorar a eficiência de I/O quando a tabela é acessada. As mudanças exatas feitas em cada tabela dependem do tipo de storage engine utilizado pela tabela.
| Se a tabela tem linhas deletadas ou divididas, repara a tabela. |
| Se as páginas de índice não estão organizadas, as organiza. |
| Se as estatísticas da tabela não estão atualizadas (e a reparação não pode ser completada organizando o índice), as atualiza. |
Para tabelas InnoDB, o OPTIMIZE TABLE é ligado ao ALTER TABLE, que recria a tabela para atualizar as estatísticas do índice e liberar espaço não utilizado no índice clusterizado.
Verificando se suas tabelas estão fragmentadas
Acesse sua base de dados execute o seguinte comando para verificar se sua base esta fragmentada:
| SELECT TABLE_SCHEMA, TABLE_NAME, TABLE_ROWS, DATA_LENGTH, INDEX_LENGTH, DATA_FREE, (DATA_FREE*100/DATA_LENGTH) as PRC FROM INFORMATION_SCHEMA.TABLES WHERE (DATA_FREE*100/DATA_LENGTH); |
O comando acima mostra no campo PRC o percentual de fragmentação levando em consideração o ‘DATA_LENGTH’ e o ‘DATA_FREE’, teoricamente quanto maior o datafree mais fragmentada está a tabela, porém este comando mostra também as tabelas InnoDB, onde o ‘datafree’ pode ter um valor maior e fixo, isto não indica fragmentação.
Para verificar as engines das tabelas e também poder visualizar o ‘DATA_FREE’ você pode rodar o seguinte comando:
| SHOW TABLE STATUS; |
Qualquer valor no campo ‘DATA_FREE’ das tabelas MyIsam é indício de fragmentação.
Desfragmentado as tabelas MyIsam, execute o seguinte comando:
| optimize table NOMEDATABELA; |
Para reindexar as tabelas InnoDB:
| ALTER TABLE `NOMEDATABELA` ENGINE=InnoDB; |
Para otimizar todas as tabelas você pode rodar o seguinte comando SSH: (a opção auto-repair faz com que dados corrompidos sejam descartados, caso queira pode omitir ‘–auto-repair’ do comando)
| mysqlcheck -h hostname -u nomedabase -psenhadabase nomedabase –optimize –auto-repair; |
pela console ou pelo ssh executar.
pvecm updatecerts